Why R and R Commander?
What is R?
Wikipedia says,"R is a programming language and software environment for statistical computing and graphics." It adds, "R was created by Ross Ihaka and Robert Gentleman at the University of Auckland, New Zealand." (Ross and Robert!)
For a comparison of statistical software, see this link. R does everything! (Statistically speaking)
Why do we need Rcmdr?
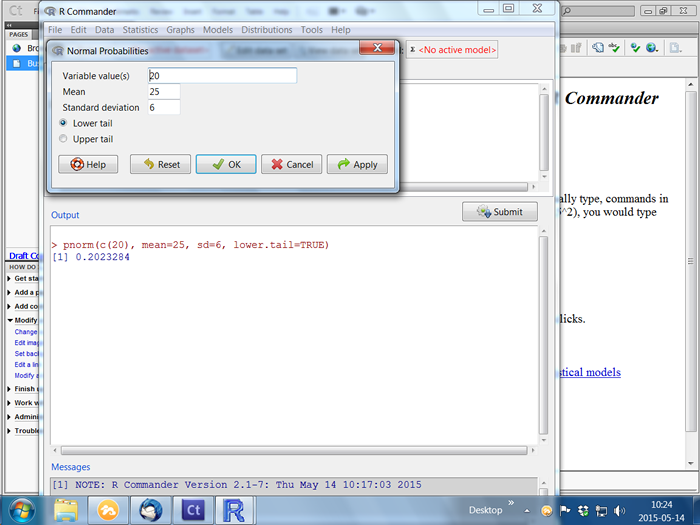
R is an extremely powerful statistical software, but it requires users to enter, i.e., manually type, commands in order to produce results. For example, to find the probability Pr(X < 20) for X ~ N(25,6^2), you would type
> pnorm(c(20), mean=25, sd=6, lower.tail=TRUE)
and obtain,
[1] 0.2023284
This operation can be simplified considerably by using Rcmdr, which, after a few simple clicks gives
Consider a more complicated problem where we want to plot a scatterplot matrix for a large dataset (which we will see in Session 1). The R commands for this problem would be,
> pairs(~AmountSpent+Catalogs+Children+Salary, reg.line=FALSE,
+   smooth=FALSE, spread=FALSE, span=0.5, id.n=0, diagonal = 'histogram',
+   data=Dataset)
which seems quite complicated and prone to error. But after a few simple clicks Rcmdr would produce the exact set of commands (with scatterplotMatrix command) we saw above and plot the following graph:
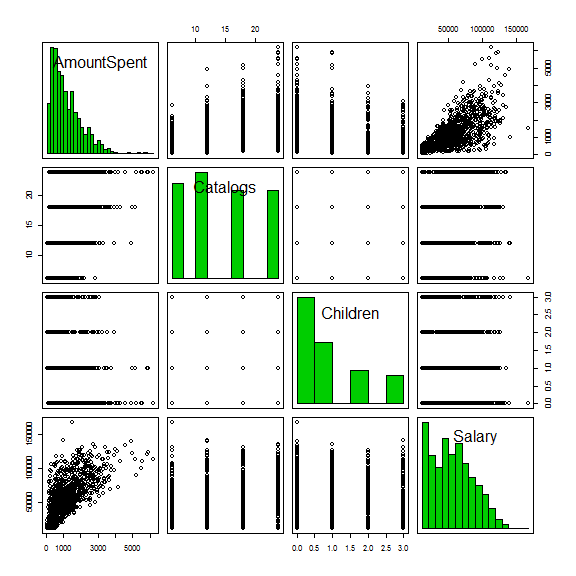
Isn't that easier?
Note: Rcmdr was developed by John Fox who is a professor in the Department of Sociology at McMaster University.