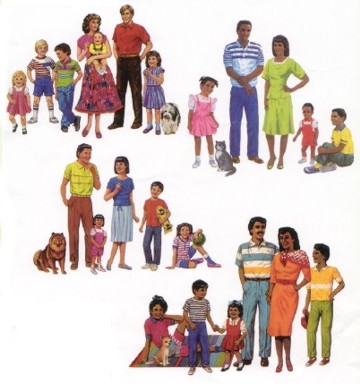
Example: The first example of clustering we will discuss is based on the data given in this diagram with six families each with different number of children (boys and girls).
The problem is this: The local government will provide child-care benefits to families depending on the total number of children in a family. The government analysts are interested in clustering families based on this total number. Which families should be in which cluster? They are interested in finding 3 or 4 clusters. Here are some possible clusterings (groupings) we can form in this problem.
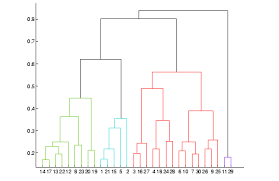
Consider the above problem with this dataset. In Rcmdr, we choose Statistics > Dimensional Analysis > Cluster Analysis > Hierarchical Cluster Analysis. It is important to note that to see the labels on the dendrogram, we need to edit the dataset and remove the first colum of numbers. Here is the output and the dendrogram. This hand-drawn dendrogram makes the point more clearly. For example, if we want 6 clusters, we choose each family as a cluster. If we need 4 clusters, we choose {F}, {A,C}, {D} and {B,E}, etc.
*****
Example: In the above example, Rcmdr did all the work for us by finding the distance matrix for the problem. In this example, given the distance matrix, I want to explain the actual steps that are involved in the calculations that lead to the clustering and the dendrogram.
*****

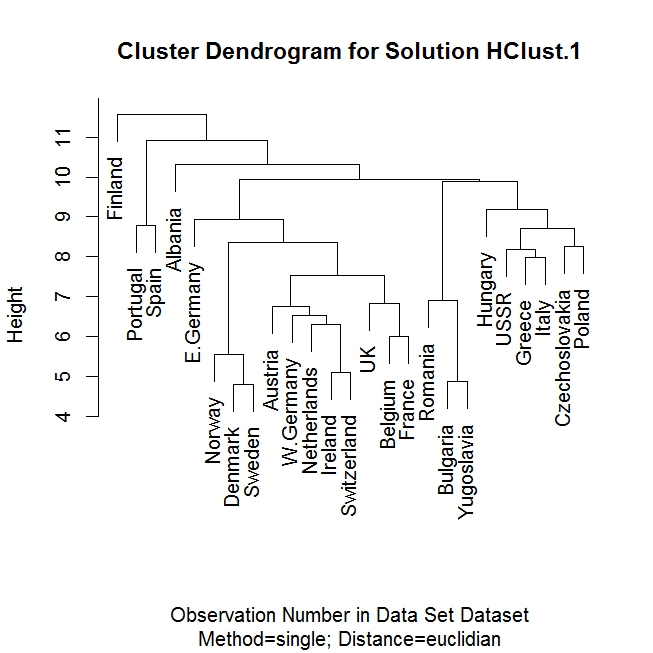
Example: We now consider a dataset with 25 European countries and their consumption of different food types. (The dataset is from the 1970s, so some of the information, such as the country names, is not current.) We wish to cluster these countries according to the food consumption similarities using the hierarchical method. Rcmdr produces this result. Since only the country number appears in the output, a better densdrogram figure with country names is provided here. It is interesting how countries with geographical proximity and similarity in cultures are grouped together in this diagram.
Exercise: Use this dataset of crime rates in different US cities and construct a dendrogram of hierarchical cluster.
(b) k-means clustering
As mentioned previously, the hierarchic techniques produce a dendrogram such as the ones shown in the three examples above. But, this procedure does not fix an a priori number of clusters. In the k-means method the algorithm assigns each item to the cluster having the nearest centroid (mean) where the value of k is given. We will illustrate the k-means method using several examples.
Here is how this method works: (1) It initially partitions the items (arbitrarily) into k clusters. (2) It then goes through the list of items and assigns an item to the cluster with the nearest mean (centroid). (3) This requires re-calculating the centroid of the cluster with the new item and the cluster losing the item. (4) Step 2 is repeated until no further assignments are possible.
*****
Example: (Family size) In this example with same dataset as above, we will solve the problem directly with the help of Rcmdr. We ask for k = 3 clusters and Rcmdr computes the centroids and also creates a new column in the dataset named KMeans indicating cluster number for each family (just view the dataset). Here are the results from Rcmdr, and the annotated graph of the three clusters with their items. This is the same result we have obtained from the hierarchical cluster calculations (hand-drawn dendrogram) when we choose three clusters.
*****
Example: (Manual calculations) In this very simple example which uses this dataset, I explain the k-means calculations in my handwritten notes. Rcmdr's results are here, which match the solution I found manually, i.e., the two clusters are A and BCD with respective means of (5,3) and (-1,-1). (To see the cluster assignments, you will need to view the dataset's KMeans column after Rcmdr finds the result.)
*****
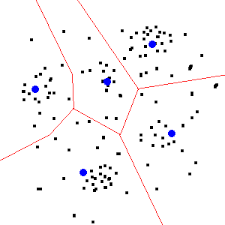
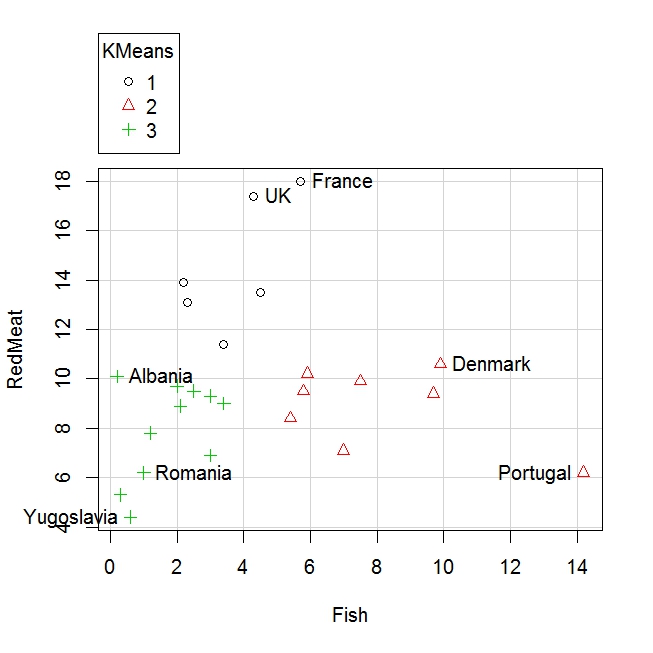
Example: (Food consumption) In this final example of k-means clustering, we return to the dataset of 25 European countries and their consumption of different food types. To illustrate the clustering graphically, we now ask Rcmdr to give us k = 3 clusters for the fish and meat consumption in these 25 countries.
The Rcmdr output is not very descriptive as it does not include the important graph. I have exported the graph here where we see that the symbols clearly partition the countries into groups with low consumption of fish and meat (+ sign), high consumption of fish (triangle sign) and high consumption of meat (circle sign). Identification of the countries is done by the mouse, which I will illustrate in class in real time.
Exercise: Use this dataset of crime rates (same as above) in different US cities and perform a k-means cluster analysis with k = 5.